map
A minimalistic library for generating low-poly maps.
map.js
A minimalistic library for generating outlines
and flat 3D shapes of maps and map regions. The library is
implemented as a single map.js file.
Table of contents
- Quick reference: examples and API
- API: constructor, names, shapes, labels and centers
- Data: XML and object
- Examples
- Simple: country, provinces and 3D map
- Intermediate: colors, elevation and labels
- Advanced: water supply, overlays and procedural maps
Quick reference
Preview of examples
Click on an image to run the example online.

Preview of the API
new Map( xmlFilename, callback, options ) // Map
new Map( object, callback, options ) // Map

map.regions // [string, string, ...]

map.region2D( regionName, height, color ) // THREE.Line
map.region3D( regionName, height, color ) // THREE.Mesh

map.geometry2D( regionName ) // THREE.BufferGeometry
map.geometry3D( regionName ) // THREE.BufferGeometry

map.label2D( regionName, label, height, color, scale, offset ) // THREE.Mesh

map.center( regionName, height ) // THREE.Vector3
API
The library map.js defines the class Map that encapsulates all the functions.
You need to create an instance of Map in order to use it.
Constructor
A map instance is created either on map date from external XML file, or on a custom created map.
new Map( xmlFilename, callback, options )
new Map( object, callback, options )
-
xmlFilenameis a name of an XML file defining the map and its regions. The library provides a low-poly map of Bulgaria inmap.xmland a more detailed map inmap-ex.xml. -
objectis a Javascript object defining the map and its regions. It could be used to provide procedural maps. -
callbackis an optional name of a user-defined callback function, that receives the map instance as parameter, when the instance is ready. This is useful for XML maps, that are loaded asynchronously. -
optionsis an optional set of configuration parameters. Its default structure is{width: 45, height: 28, roundness: 25}, wherewidthandheightdefine the size of the map, androundnesssets the rounding radius of some vertices in the map.
There are three typical patterns for making instances of Map.
The first one uses a callback function to process the map, once
it is ready:
new Map( 'map.xml', drawMap );

function drawMap( map )
{
  // map is ready to be used
}
The second pattern uses the => syntax:
new Map( 'map.xml', map => {/*map is ready to be used*/} );
The third pattern is applicable only to procedural maps, when the map data is not load asynchronously from external file. In such case the map instance can be immediately used.
var map = new Map( proceduralMap );

// map is ready to be used
Region names
map.regions
This property contain an array of the names of all regions. It can be used to traverse through all regions in the map:
for( regionName in map.regions )
{
  // regionName contains the name of a region
}
The provided maps map.xml and map-ex.xml define the shapes of Buigaria
and its provinces. These shapes are all treated as regions. To traverse
only the provinces the code can filter out the country by its region name:
for( regionName in map.regions )
  if( regionName != 'BG' )
  {
    // regionName contains only the name of a province
  }
Region shapes
map.region2D( regionName, height, color ) // THREE.Line
map.region3D( regionName, height, color ) // THREE.Mesh
These methods generate a 2D shape (outline) or a 3D shape (flat bar)
of the region called regionName. Optional parameters height
and color define the heigh and the color of the shape.
By default height is 1 and color is 'black' for 2D shapes
and 'white' for 3D shapes.
The raw geometry of a region is generated by these two methods:
map.geometry2D( regionName ) // THREE.BufferGeometry
map.geometry2D( regionName ) // THREE.BufferGeometry
Region label
map.label2D( regionName, labelText, height, color, scale, offset ) // THREE.Mesh
The method label2D generates a 2D rectangular shape
containing a given labelText. The shape is positioned
at the center of region called regionName. The vertical
location of the label is set by height, its colour is color
and scale is a number scale. The last parameter offset is
a number used to shift the label as of it is on another line
in a multiline text. By default, height=1, color='black',
scale=1 and offset=0.
Region center
map.center( regionName, height ) // THREE.Vector3
This method returns the virtual center of a region. It is used
internally by map.label2D to position labels and
by the user program to place other objects over regions.
Map data
The library builds 2D and 3D shapes of regions based on map data. There are two ways to provide these data: as XML file and as Javascript object.
XML Data
Regions
The XML files included in the libabry are exported from file
map.drawio which can be be edited in Diagrams.net (previously known as Draw.io).
The Map class has minimal parser of XML files, i.e. its
looks only for specific nodes, ignoring all the rest. The
structure of the XMl file must be like this:
<?xml version="1.0" encoding="UTF-8"?>
<mxfile ...>
  :
  <mxCell value="BG" ...>
    <mxGeometry x="0.635" y="149" width="50" height="50" relative="1" as="geometry">
      <mxPoint x="370" y="-620" as="sourcePoint" />
      <Array as="points">
          <mxPoint x="540" y="-550" />
          <mxPoint x="540" y="-510" />
		  :
          <mxPoint x="220" y="-330" />
      </Array>
      <mxPoint x="1" as="offset" />
	</mxGeometry>
  </mxCell>

  <mxCell value="region-name" ...>
    :
  </mxCell>
  :
</mxfile>
Each region is defined as <mxCell> with the name of the
region in attribute value. The geographical shape of the
region is defined by a starting point <mxPoint ... as="sourcePoint">
and a list of next consequitive points <mxPoint> from <Array>.
In the example above the first region is called BG and
its shapes is defined by points (370,-620), (540,-550), (540,-510), ... (220,330).
The position of the label (this is the virtual center) is
calculated from the data in <mxGeometry ...> and
<mxPoint ... as="offset">.
Locations
The map in file examples\example-8.xml contains locations of cities.
Such locations are not encoded as shapes of points. The XML parser
extract the coordinates and generates a small circle as a shape.
  :
  <mxCell value="region-name" ...>
    <mxGeometry x="1330" y="322" as="geometry" .../>
  </mxCell>
  :
</mxfile>
Object Data
When the map data is provided as a Javascript object it must have the following structure:
{
  name: {shape:[x1, y1, x2, y2, ...], label: [x,y]},
  name: {shape:[x1, y1, x2, y2, ...], label: [x,y]},
  :
}
where name is the name of a region, shape is an array of
3 or more pairs of 2D coordinates (x1,y1), (x2,y2), … defining
the outline of the region, and label is an array of one pair of
2D coordinates (x,y) of the location of the region label.
Examples
The following examples show code sniplets. Click on the image to run the example in real-rime in your browser. Use your default pointing device to change the viewpoint.
Simple examples
These examples show the basic functionality of maps.js –
using 2D and 3D shapes of regions.
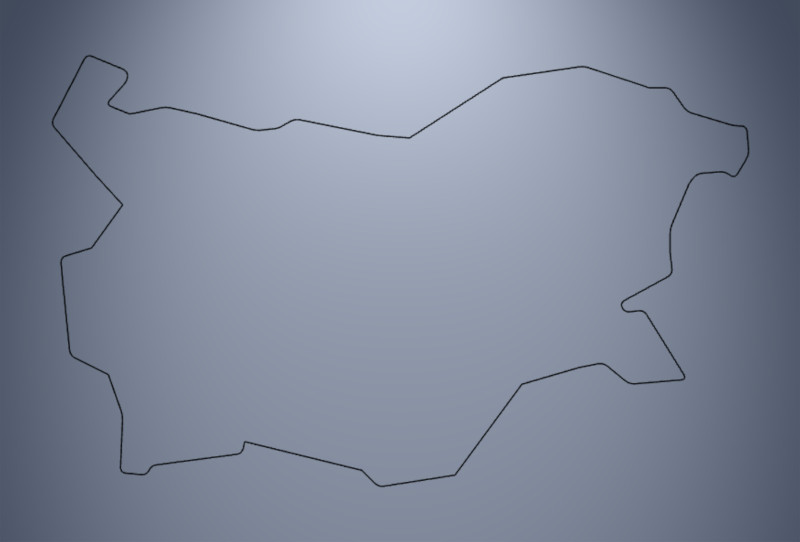
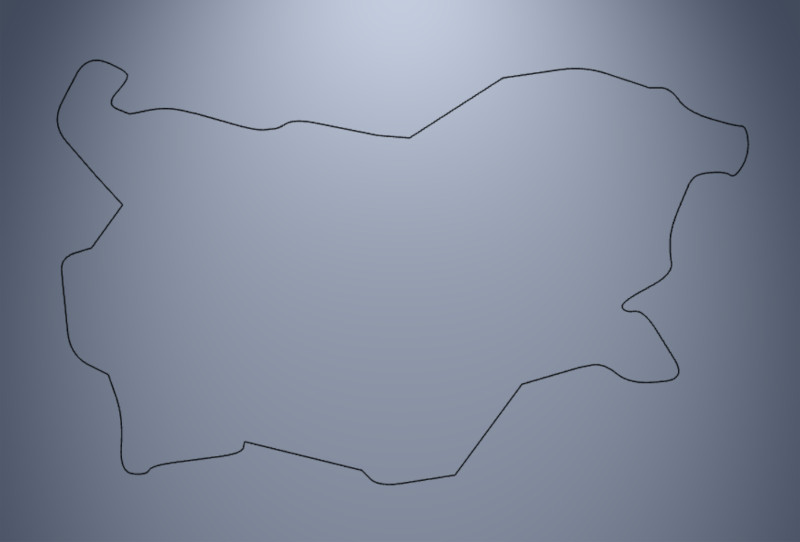
Outline of country
This example draws the outline of Bulgaria as a 2D shape.
new Map( '../map.xml', drawMap );

function drawMap( map )
{
  scene.add( map.region2D( 'BG' ) );
}
The following two versions of the example show the role of the
roundness parameter in the map options.
Sharp outline with roundness=0:
new Map( '../map.xml', drawMap, {roundness: 0} );

Smooth outline with roundness=100:
new Map( '../map.xml', drawMap, {roundness: 100} );
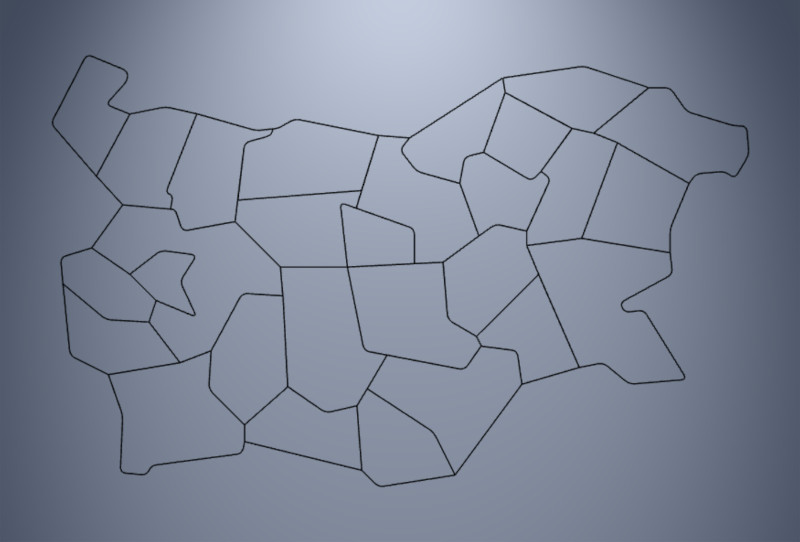
Outlines of provinces
This example draws the outlines of Bulgarian provinces. The outline of the contry is excluded.
new Map( '../map.xml', drawMap );

function drawMap( map )
{
  for( var regionName in map.regions )
    if( regionName != 'BG' )
      scene.add( map.region2D( regionName ) );
}
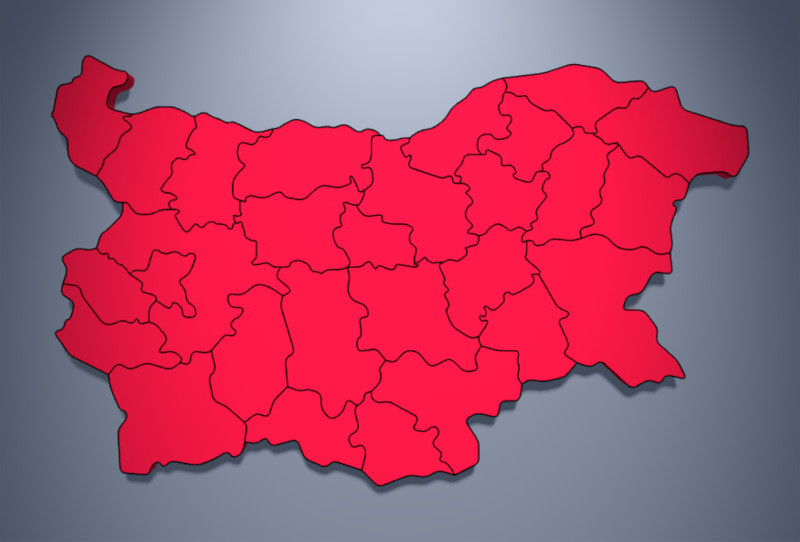
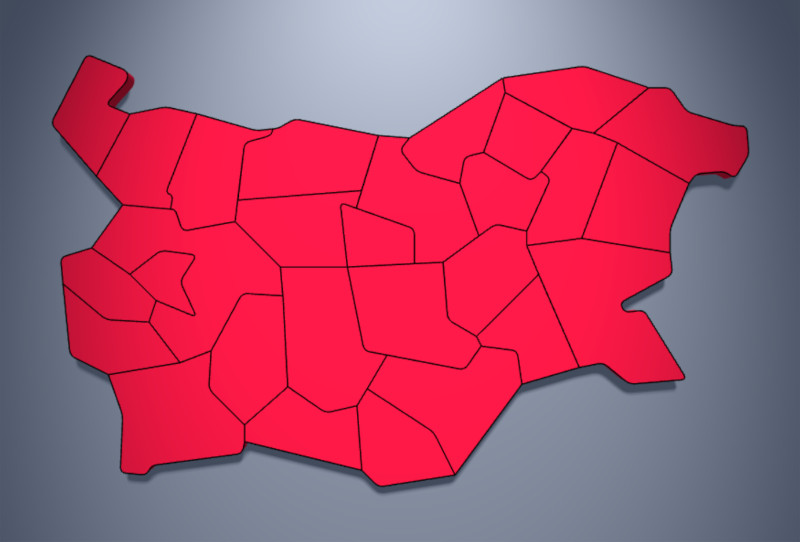
3D map
new Map( '../map.xml', drawMap );

function drawMap( map )
{
  // draw Bulgaria as 3D plate
  scene.add( map.region3D( 'BG', 1, 'crimson' ) );

  // draw provinces outlines
  for( var regionName in map.regions )
    if( regionName!='BG' )
      scene.add( map.region2D( regionName ) );
}
The same example using the extended map map-ex.xml instead of map.xml:
Intermediate examples
These examples show modification of regions – different colors, heights and labels.
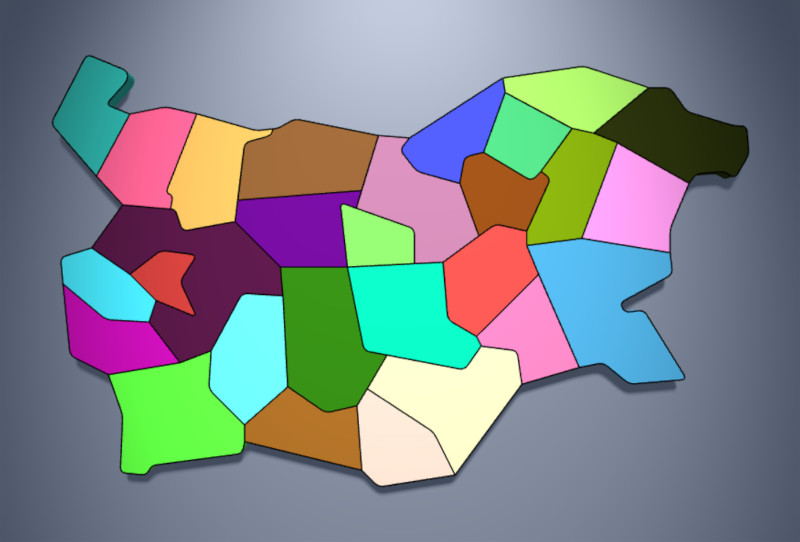
Colored provinces
This example paints every province in a random color.
new Map( '../map.xml', drawMap );

function drawMap( map )
{
  for( var regionName in map.regions )
    if( regionName!='BG' )
    {
      var color = new THREE.Color( 0xFFFFFF*Math.random() );

      scene.add( map.region3D( regionName, 1, color ) );
      scene.add( map.region2D( regionName, 1 ) );
    }
}
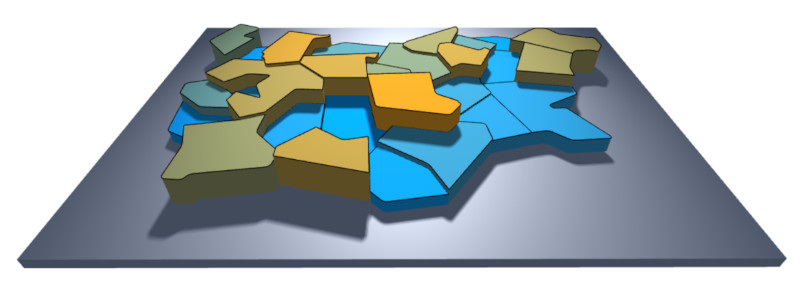
Elevated provinces
This example generates random value for a province and then uses this value to determin the height (elevation) and the color.
new Map( '../map.xml', drawMap );

function drawMap( map )
{
  for( var regionName in map.regions )
    if( regionName!='BG' )
    {
      var value = Math.random();
      var color = new THREE.Color( value, 0.6, 1-value );
      var height = 1+3*value;

      scene.add( map.region3D( regionName, height, color ) );
      scene.add( map.region2D( regionName, height ) );
   }
}
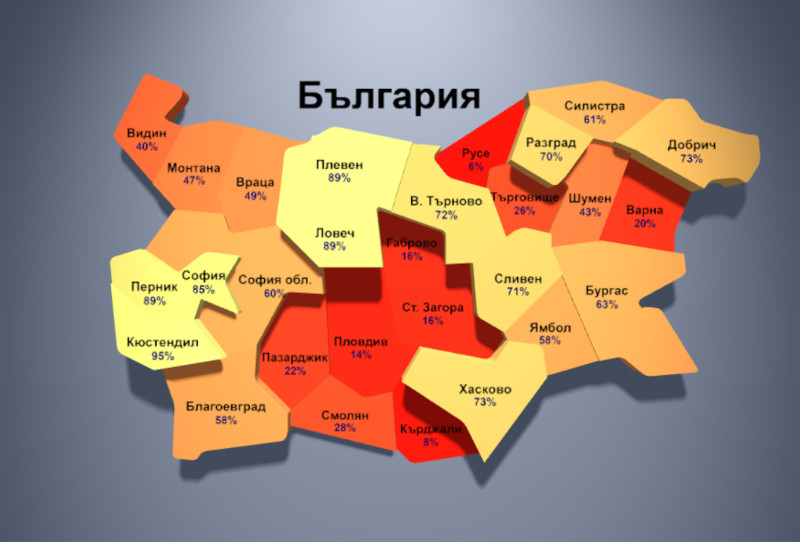
Labels of provinces
This example shows how labels are done. Because provinces’ names
are encoded in the map as BG, BL, BU and so on, there is
an array of the full names of the provinces.
new Map( '../map.xml', drawMap );

var fullNames = {BG: 'България', BL: 'Благоевград', ... YA: 'Ямбол' };

function drawMap( map )
{
  :
  for( var regionName in map.regions ) if( regionName!='BG' )
  {
    :
    scene.add(
      // province name
      map.label2D( regionName, fullNames[regionName], value, 'black', 0.8 ),
      // province percentage
      map.label2D( regionName, Math.round(100*value/3.1)+'%', value, 'navy', 0.7, 1.2 )
    );
  }
}
Advanced examples
These examples shows advanced usage of map.js by combining
different objects and composing more complex maps.
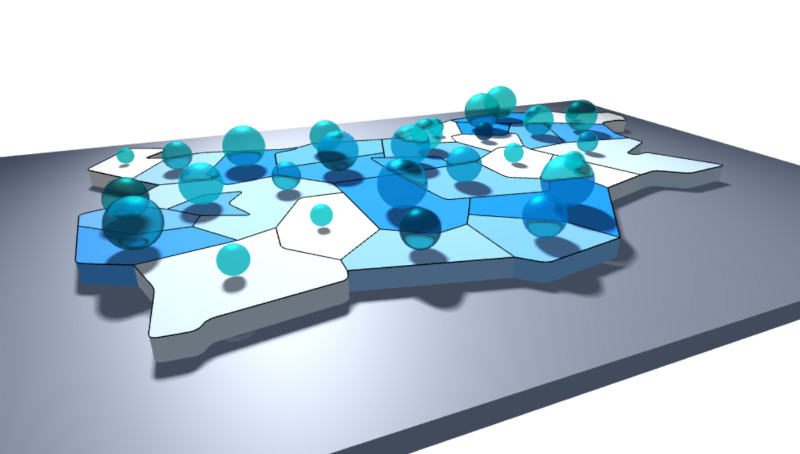
Water supply
Imaginary map of water supply per province.
new Map( '../map.xml', drawMap );

function drawMap( map )
{
  for( var regionName in map.regions )
    if( regionName!='BG' )
    {
	  :
      scene.add( map.region3D( regionName, 1, color ) );
      scene.add( map.region2D( regionName, 1 ) );

      var water = new THREE.Mesh(
         new THREE.IcosahedronGeometry( radius, 4 ),
         new THREE.MeshPhysicalMaterial( {...} )
      );

      water.position.copy( map.center( regionName, 1+radius ) );
      water.castShadow = true;

      scene.add( water );
   }
}
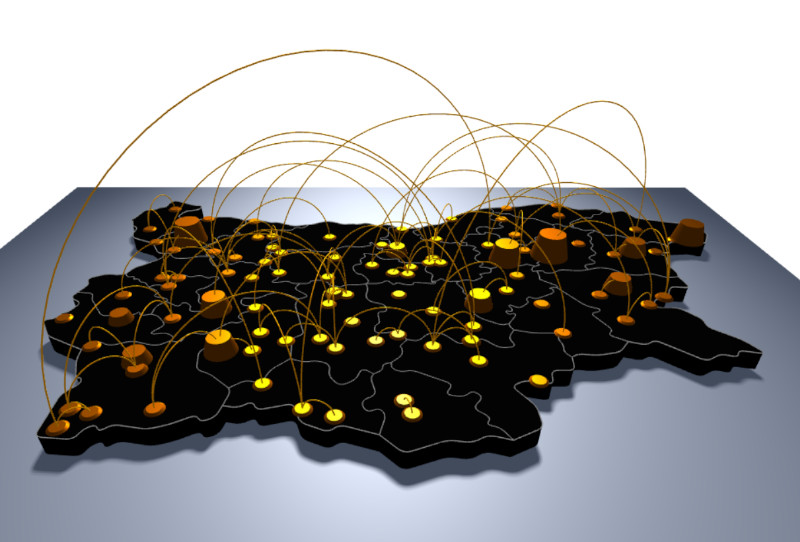
Overlaying maps
Map map-ex.xml provides outlines of provinces, map example-8.xml
provides locations of towns. To have both maps with equal sizes and
positions, they have the same region for the whole country. As the
maps are loaded asynchronously, they are chained:
new Map( '../map-ex.xml', loadCityMap );

function loadCityMap( map )
{
  countryMap = map;
  new Map( 'example-8.xml', drawMap );
}

function drawMap( cityMap )
{
  // using countryMap for provinces and cityMap for cities
  :
}
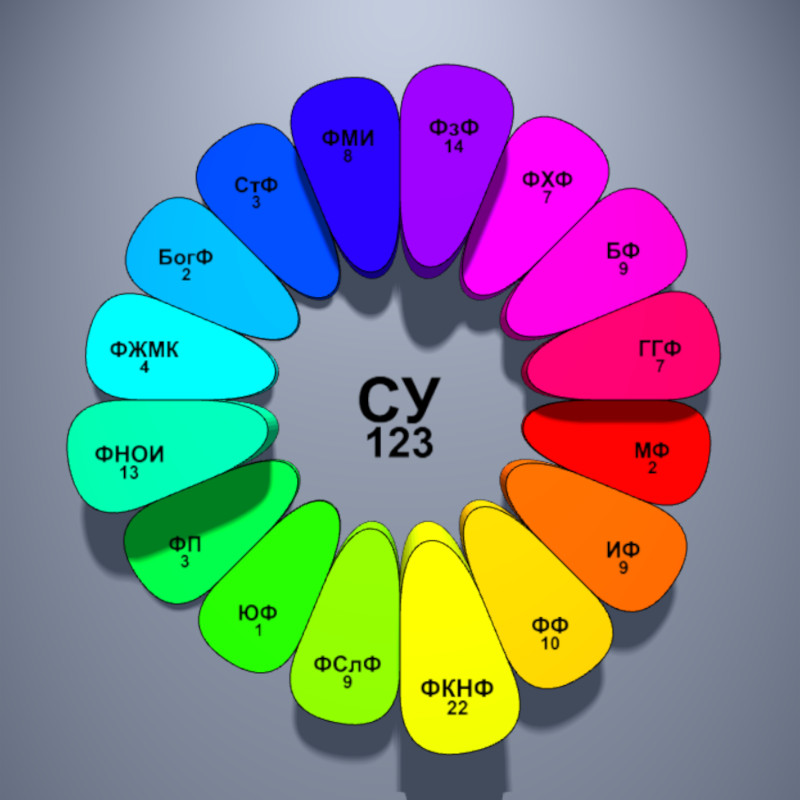
Procedural maps
Example of number of undergraduate programs in the 16 faculties of Sofia University. The map of the faculties is generated procedurally. The example also rotates the labels according to the viewer position.
// generate a procedural map
var proceduralMap = {};
{
  // functions to calculate coordinates
  function x( ... ) { ... }
  function y( ... ) { ... }

  // the university as shapeless object
  proceduralMap[names[0]] = {shape: [], label: [0,0]};

  // the faculties
  for( var i=1; i<names.length; i++ )
    proceduralMap[names[i]] = {
      shape: [x(...), y(...), x(...), y(...), ...],
      label: [x(...), y(..) ]
    };
}

// map of faculties
var map = new Map( proceduralMap, null, {roundness:5} );
:
October, 2021